Personal finance insights: news & features
By: Dr K C Gupta
CONTRARIAN INDICATORS
AAII Bull-Bear Spread +12.5% (above average)
CNN Fear & Greed Index 51 (neutral)
NYSE %Above 50-dMA 71.65% (overbought)
SP500 %Above 50-dMA 72.20% (overbought)
ICI Fund Allocations (Cumulative), 11/30/25
OEFs & ETFs: Stocks 61.55%, Hybrids 4.05%, Bonds 17.36%, M-Mkt 17.04%
INTEREST RATES
CME FedWatch
Cycle peak 5.25-5.50%
Current 3.50-3.75%
FOMC 1/28/26+ hold
FOMC 3/18/26+ hold
Treasury
T-Bills 3-mo yield 3.62%, 1-yr 3.52%; T-Notes 2-yr 3.54%, 5-yr 3.75%, 10-yr 4.18%; T-Bonds 30-yr 4.82%;
TIPS/Real yields 5-yr 1.43%, 10-yr 1.90%, 30-yr 2.58%
FRNs Index 3.572%
Bank Rates www.depositaccounts.com/
Stable-Value (SV) Rates, 1/1/26
TIAA Traditional Annuity (Accumulation) Rates
Restricted RC 5.00%, RA 4.75%
Flexible RCP 4.25%, SRA 4.00%, IRA-101110+ 3.50%
TSP G Fund 4.250% (previous 4.125%)
India Fear & Greed MMI 29.26 (extreme fear, barely)
Weekly ETFs: INDA -2.54%, INDY -2.28%, EPI -2.82%, INDH -2.32%, SPY +1.60%
The data above are as of Sunday preceding the publication date.
GEOPOLITICAL
Indian oil companies have exposure to Venezuelan oil – ONG Videsh, IOC, Oil India. Crude oil imports from Venezuela are only about 0.35% of Indian oil imports, but they were much higher before; Venezuelan oil importers include Reliance Industries, Nayara Energy. Besides oil, there are minor exposures by companies in pharma – Sun Pharma, Glenmark Pharma, Cipla, Dr Reddy’s Labs. Indian investments of about $1 billion in Venezuela have been stuck due to sanctions on Venezuela. US involvement in Venezuela may help India in recovering its investments.
Venezuela has the highest proven oil reserves, but its production level is small. Its oil is heavy/sour grade. Many refineries need a mix of sour & sweet (light) crude oil. In proven oil reserves, #1-Venezuela, #2-Saudi Arabia, #3-Iran, #4-Iraq, #5-UAE. For oil production, #1-US, #2-Saudi Arabia, #3-Russia, #4-Canada, #5-China.
Chinese investments & loans to Venezuela are $100+ billion, most of them before Venezuela joined China’s Belt & Road Initiative (BRI) in 09/2018.
Notably, Venezuela’s Russian & Chinese defensive systems were totally ineffective during the US raid on 1/3/26. They were neutralized early by US missiles/drones, or there was secret cooperation by high-level Venezuelan defense officers. The hardliner VP Delcey Rodriguez, now the President, seems more acceptable to US than the opposition leader & Nobel Laureate Maria Machado.
Russia only protested about the seizure of a Russian-flagged oil tanker near Iceland by US Coast Guard Cutter (USCGC).
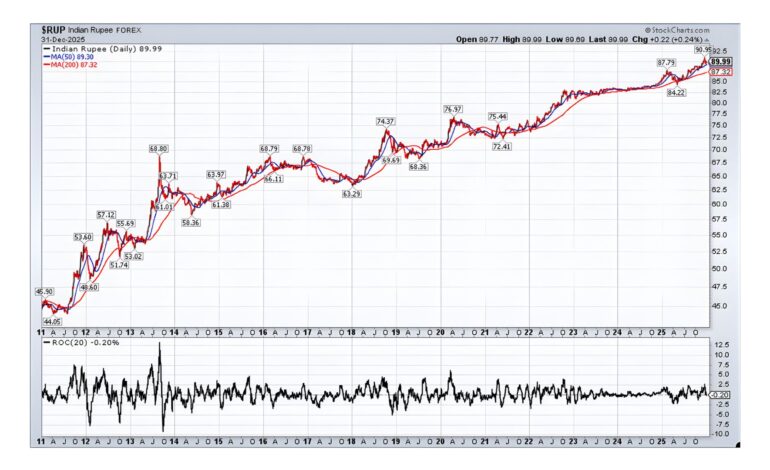
SPECIAL TOPIC – INDIAN RUPEE
Indian rupee keeps falling year after year. It was the worst Asian currency in 2025.
Economically, weak currency benefits exports but makes imports expensive. This is good for international trade in general, but becomes a problem when some bilateral trades have large deficits (i.e. more imports than exports). Higher import costs make related products more expensive & lead to higher inflation.
Bilateral trade in local currencies is touted a lot, but that only works if the trade is in balance. For example, if India has a large trade deficit (imports >> exports) in a bilateral trade, then the trading country ends up with lot of excess rupees that it cannot repatriate or use globally. Then, the trading country may demand payments in dollar, euro, dirham, etc.
India has huge trade deficits related to oil, advanced technology, defense, gold, etc. To meet high domestic demand, Indian gold imports are much more than those need to support the jewelry exports.
Weak rupee hurts Indian consumers as steady rupee devaluation eats into their purchasing power & savings. It’s a silent factor that shows up as inflation.
It also hurts foreign investors because rupee devaluation cuts into their returns from investments in India when those returns are translated into their own currencies. This is why when Indian stock market rallies to new highs, the global reaction is often lukewarm. There are several India ETFs available in the US – INDA, INDY, EPI, INDH, & only the tiny INDH is rupee-hedged.
A chart of rupees in dollars ($RUP at StockCharts) from 12/31/10 – 12/31/25 is shown in a nearby picture; the bottom panel shows rolling monthly changes. The chart link is,
schrts.co/QZtvjvjc
Sample values for rupees for $1 at yearends are as shown:
2010 44.70,
2011 53.01, 2012 54.99, 2013 61.80, 2014 63.16, 2015 66.23,
2016 67.96, 2017 63.83, 2018 69.49, 2019 71.21, 2020 73.05,
2021 74.49, 2022 82.74, 2023 83.25, 2024 85.55, 2025 89.99.
Some say that 92 level may be breached soon in this move.
The annualized devaluation rate for rupee vs US dollar over 15 years is -4.775%, quite high for a national currency.
A steady rupee would require balanced budgets, higher productivity, higher per capita GDP, trade surpluses – none of these are quick fixes.
For more information, see https://ybbpersonalfinance.proboards.com/